● EARTH ENGINE CONNECTED LAT 20.5937° N   LON 78.9629° E   SCALE 1:250,000
R · Google Earth Engine · Machine Learning

Geospatial analysis and land-cover classification, run directly in your browser.

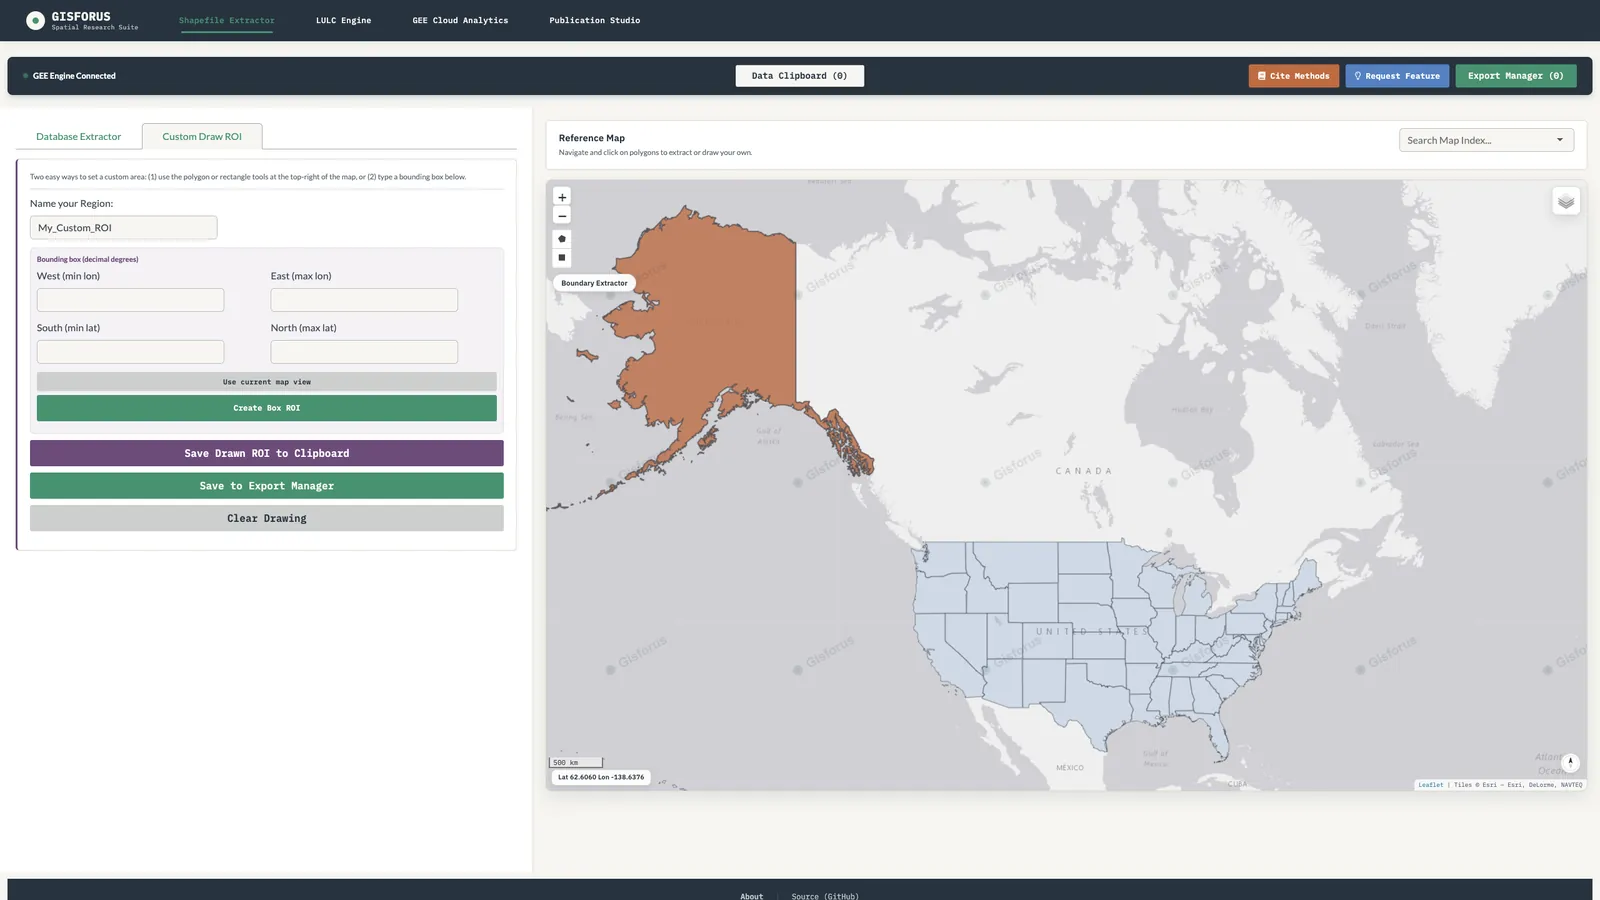
Spatial Research Suite is a research tool for people who work with satellite imagery: extract administrative boundaries, classify land cover with Random Forest or CART, detect statistically significant trends, and export a publication-ready map — without installing desktop GIS software or writing Earth Engine code.

Featured on Product Hunt
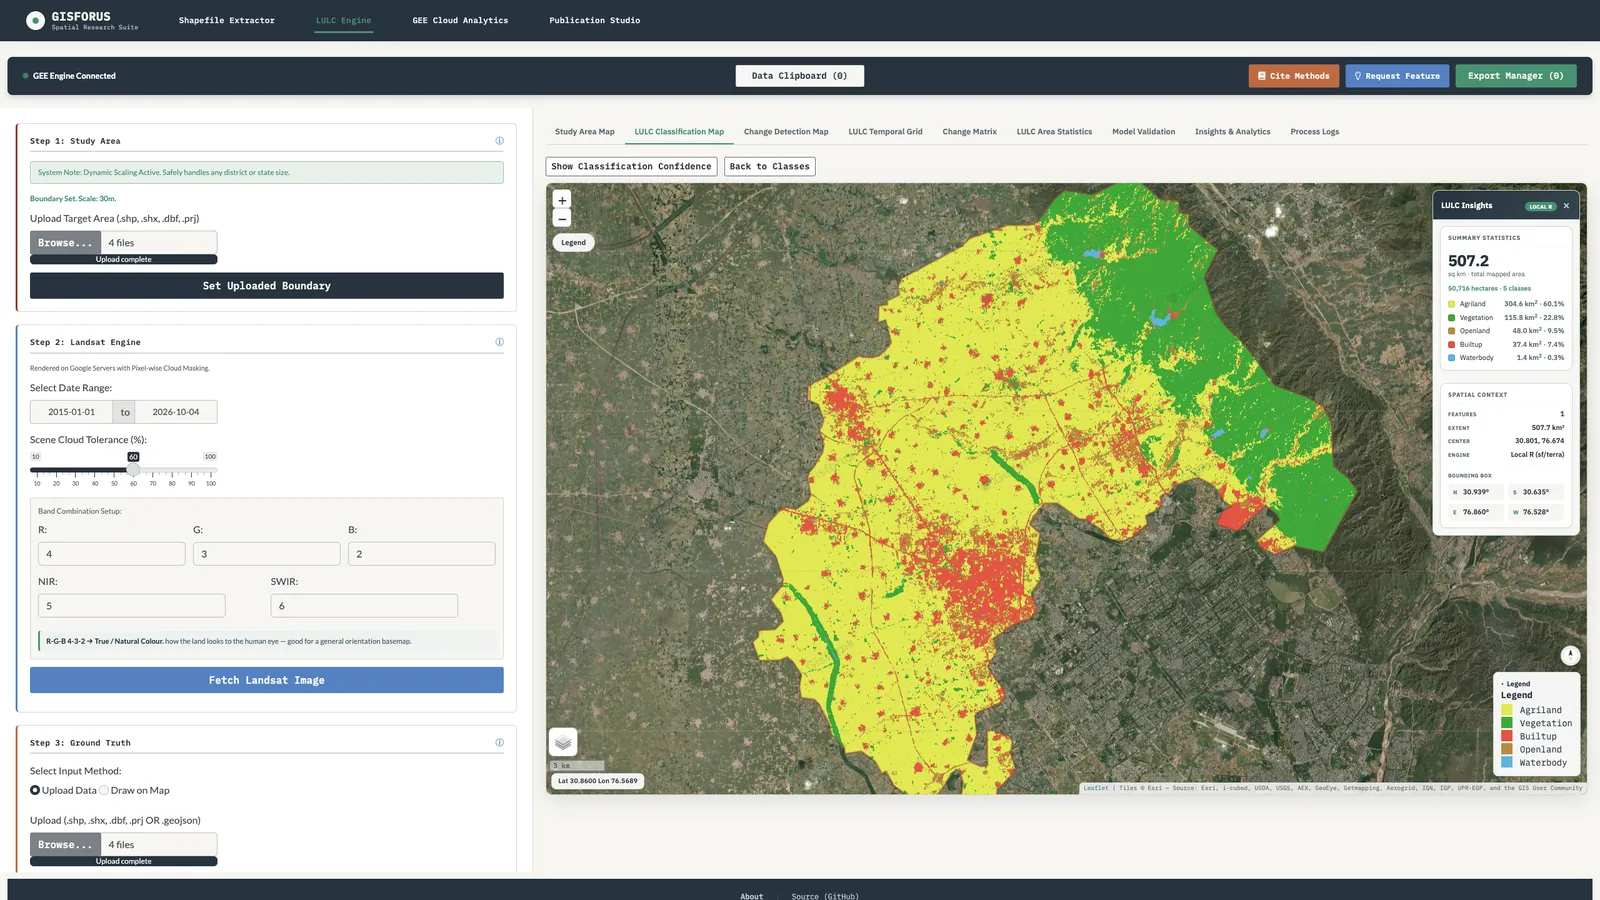
LULC_CLASSIFICATION.TIF SENTINEL-2 · 10m · RANDOM FOREST
Vegetation Waterbody Built-up
21.4489° N, 79.0882° E
⋮ 5 km

Five tools, one boundary.

Set a study area once. Every tool below works from that same boundary, so you're not re-uploading shapefiles between steps.

CLASSIFICATION

Land-cover classification

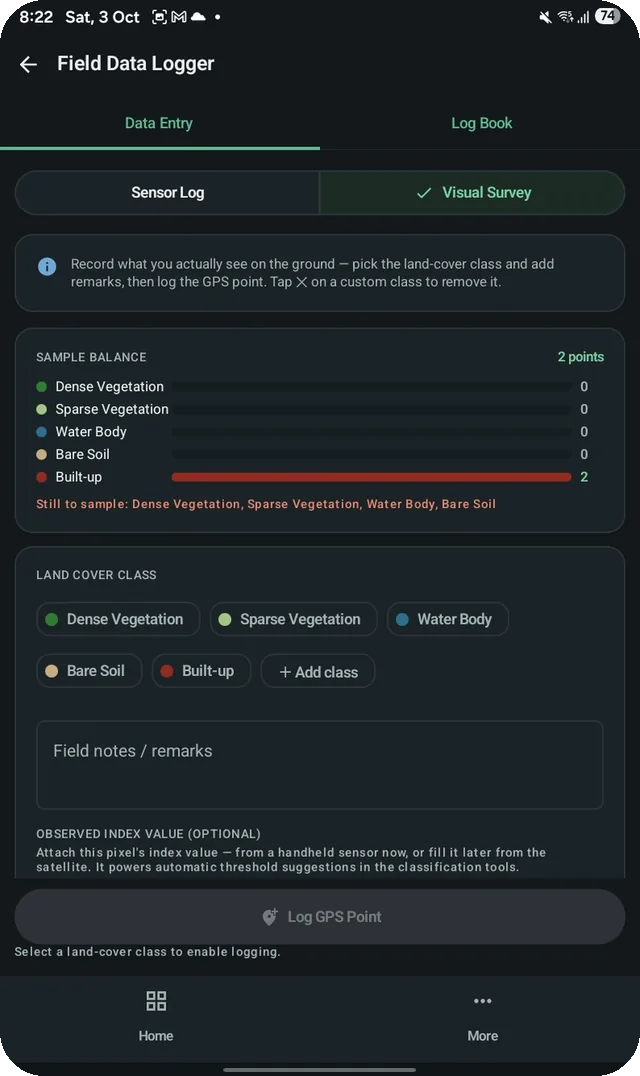
Train Random Forest, CART, or SVM classifiers on your own ground-truth points. Includes per-pixel confidence mapping and a held-out validation accuracy report — not just training accuracy.

TIME SERIES

Multi-year trend detection

Fit a per-pixel linear trend across any year range, with a Mann-Kendall significance test to separate real change from noise. Harmonized Landsat 5/7/8/9 data extends coverage back to 1984.

CHANGE DETECTION

Spatial change mapping

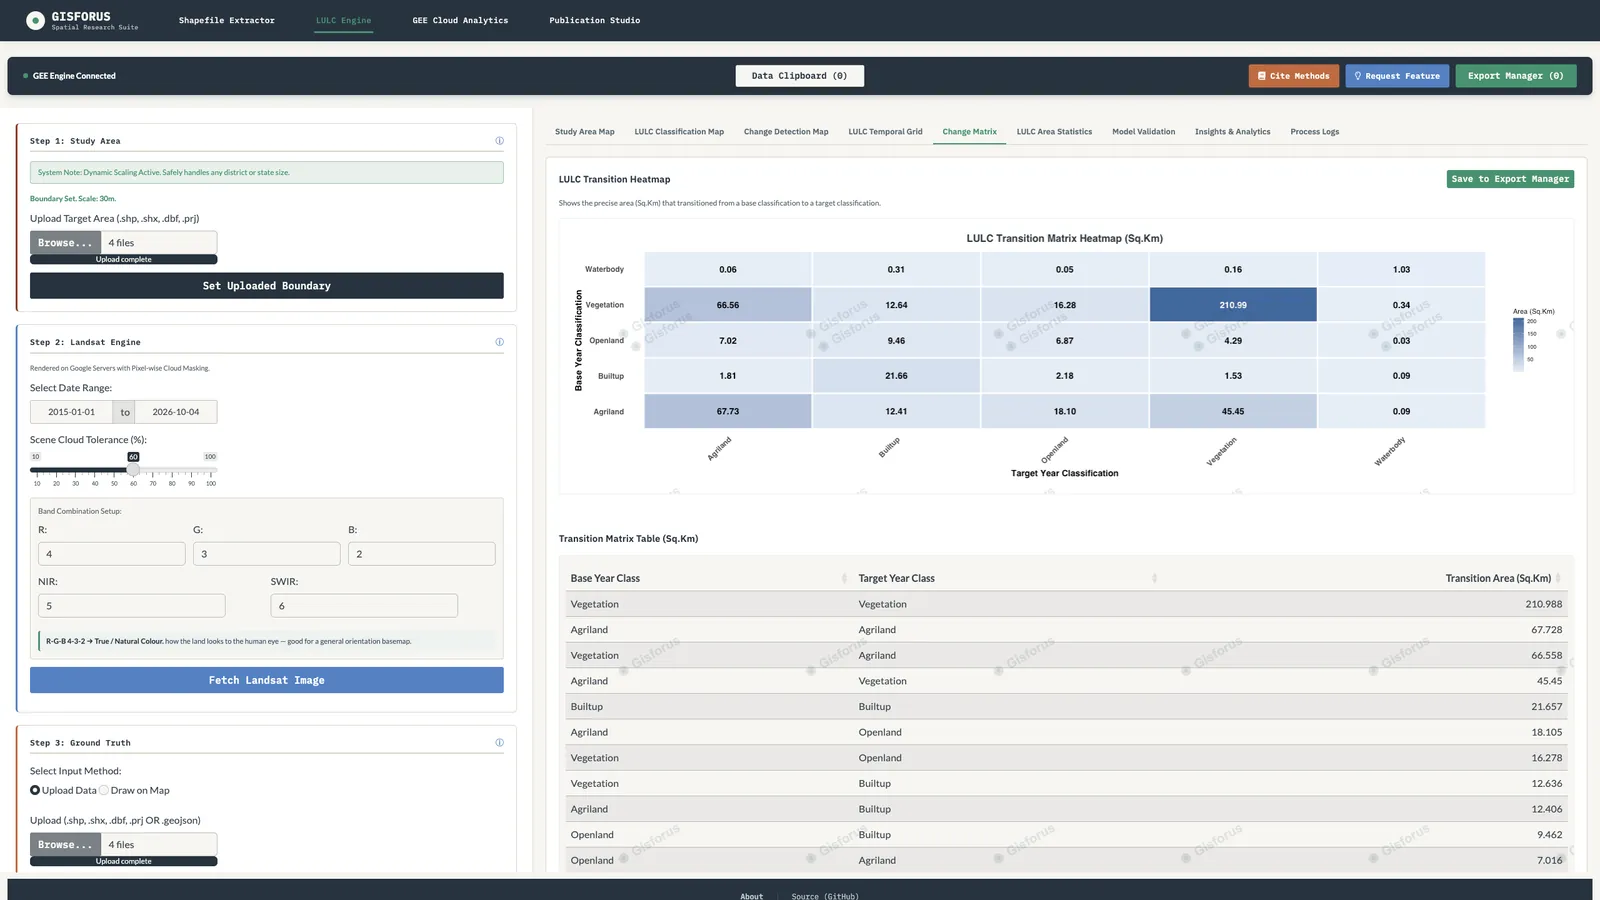
Auto-generated transition matrices and a spatial change-detection map, with minimum mapping unit filtering to remove classification noise between two dates.

STATISTICS

Batch and correlation analysis

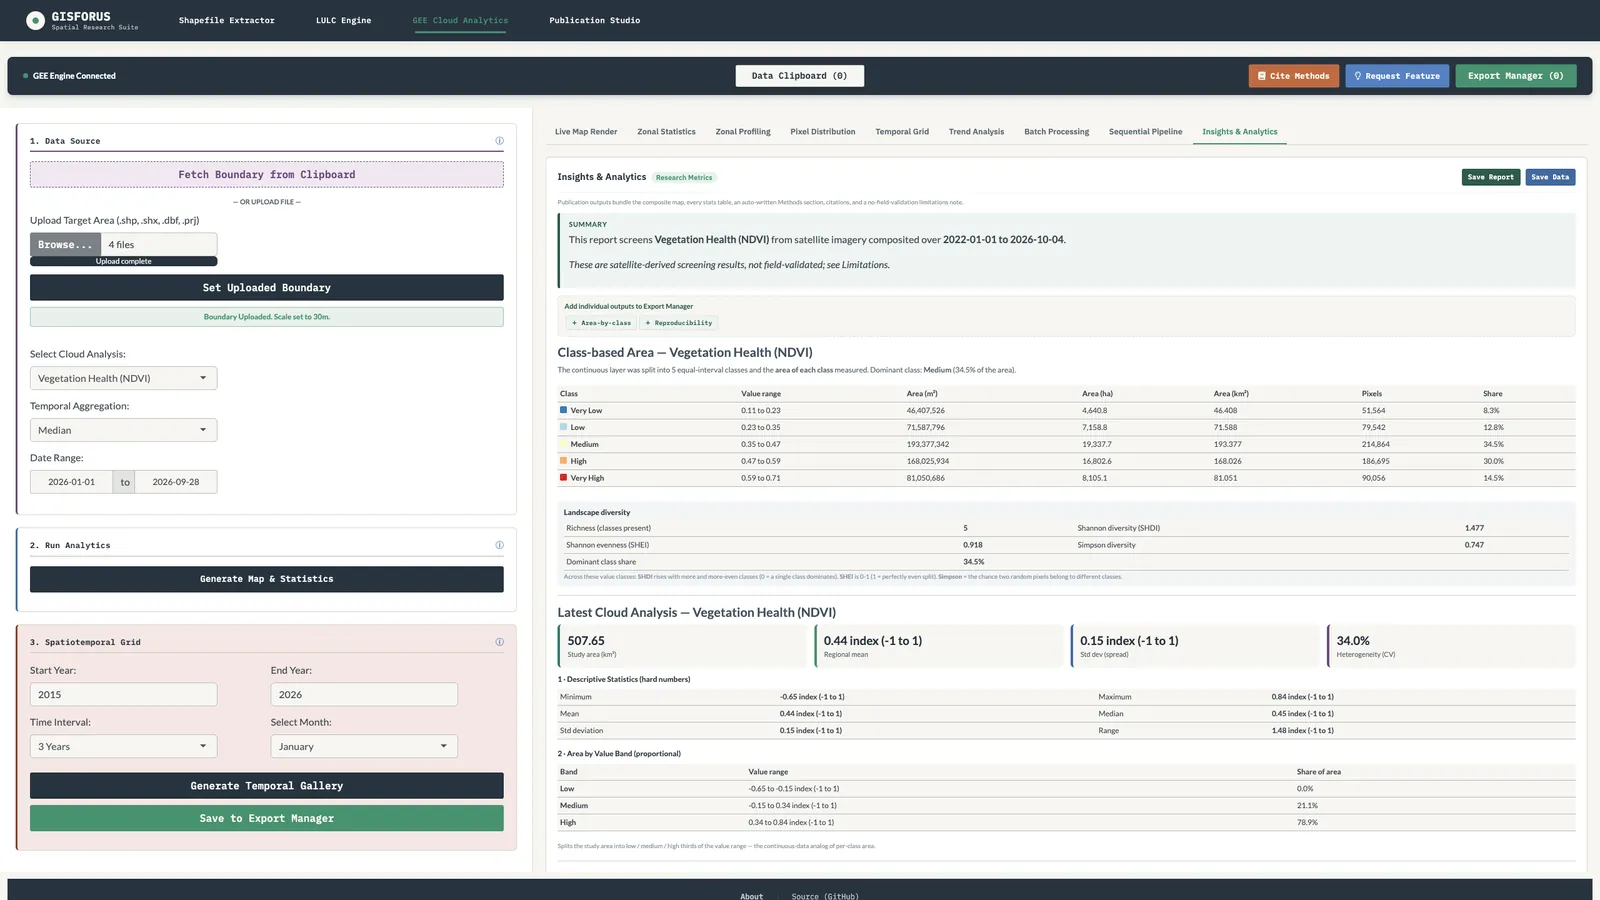
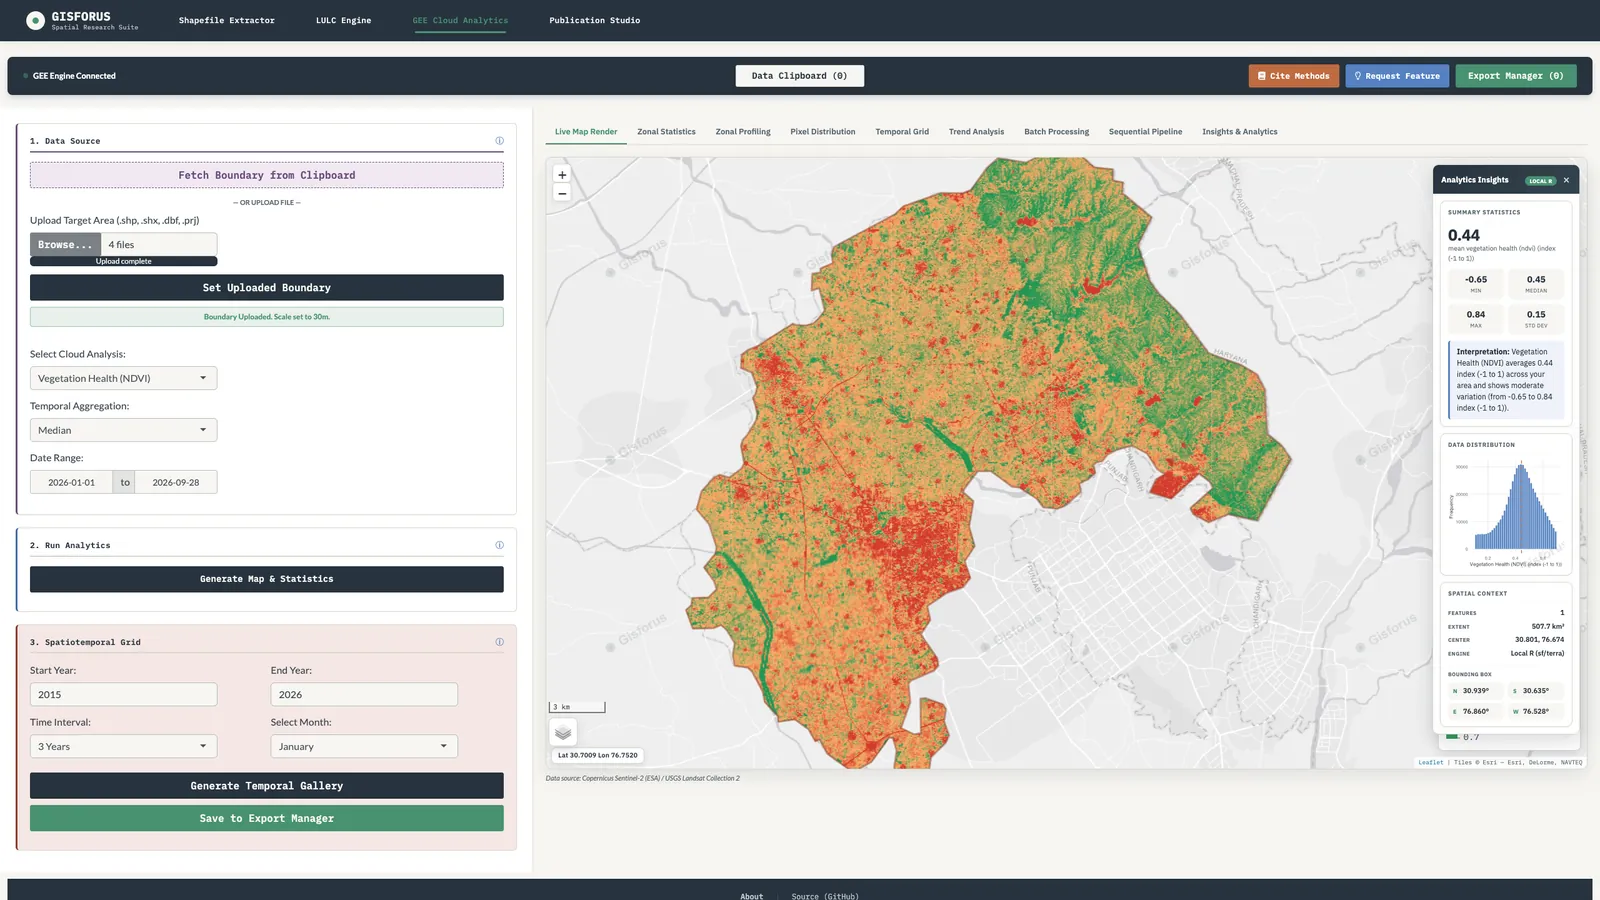
Run zonal statistics across dozens of boundaries in a single server-side call. Test correlations between any two variables — vegetation and temperature, for example — with a scatter plot and Pearson's r.

From boundary to publication figure.

The same four steps whether you're running a quick NDVI check or a full classification.

01

Define your study area

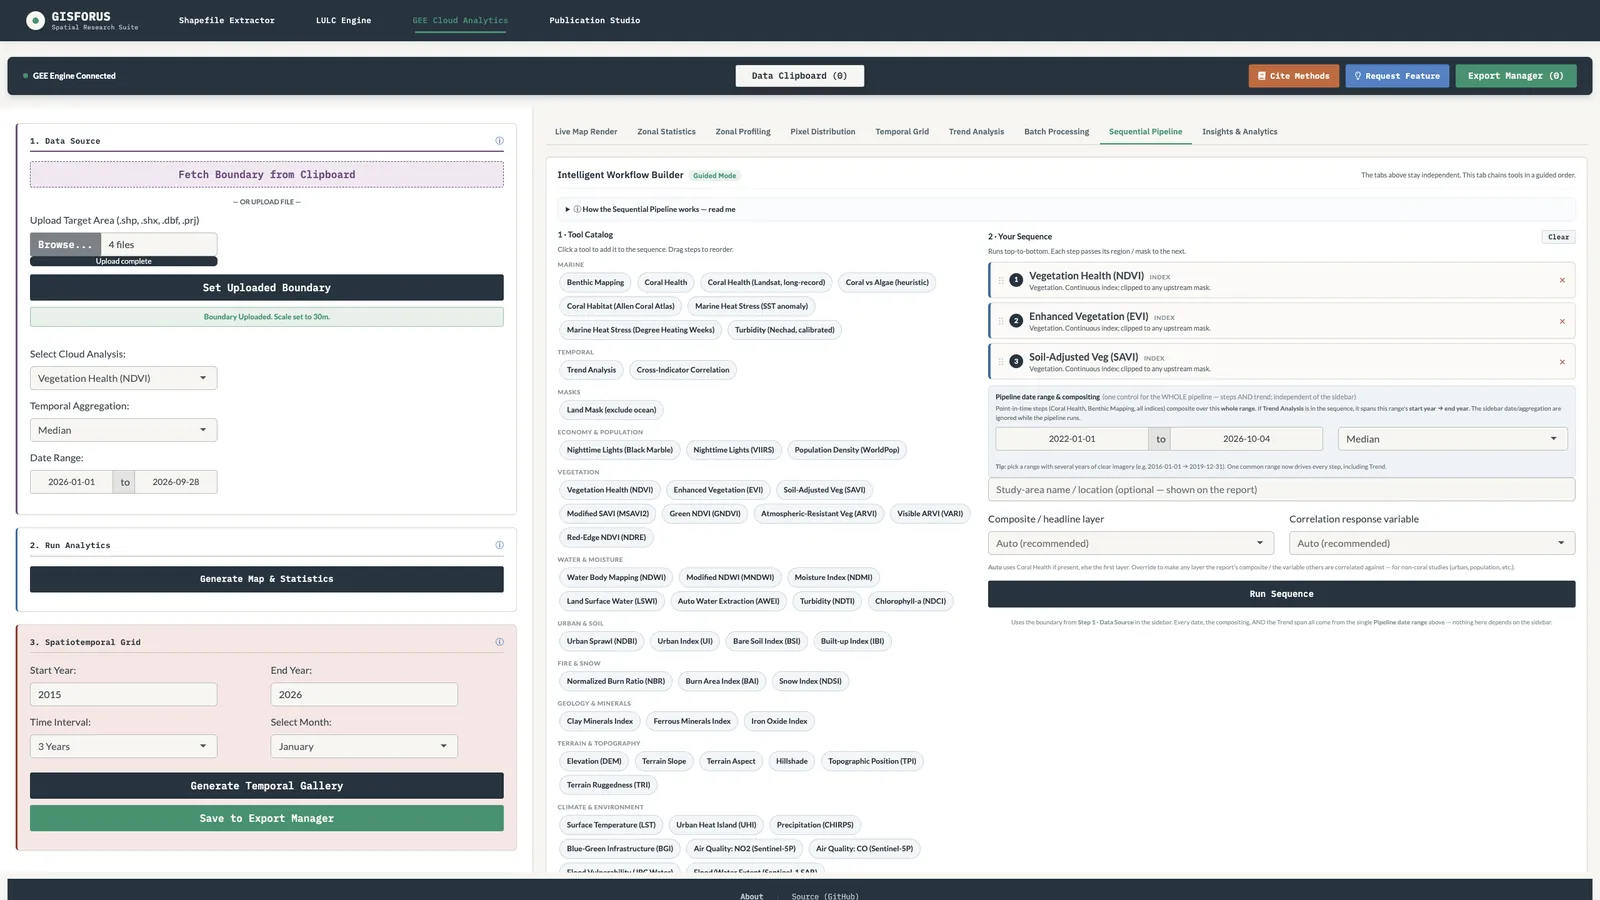
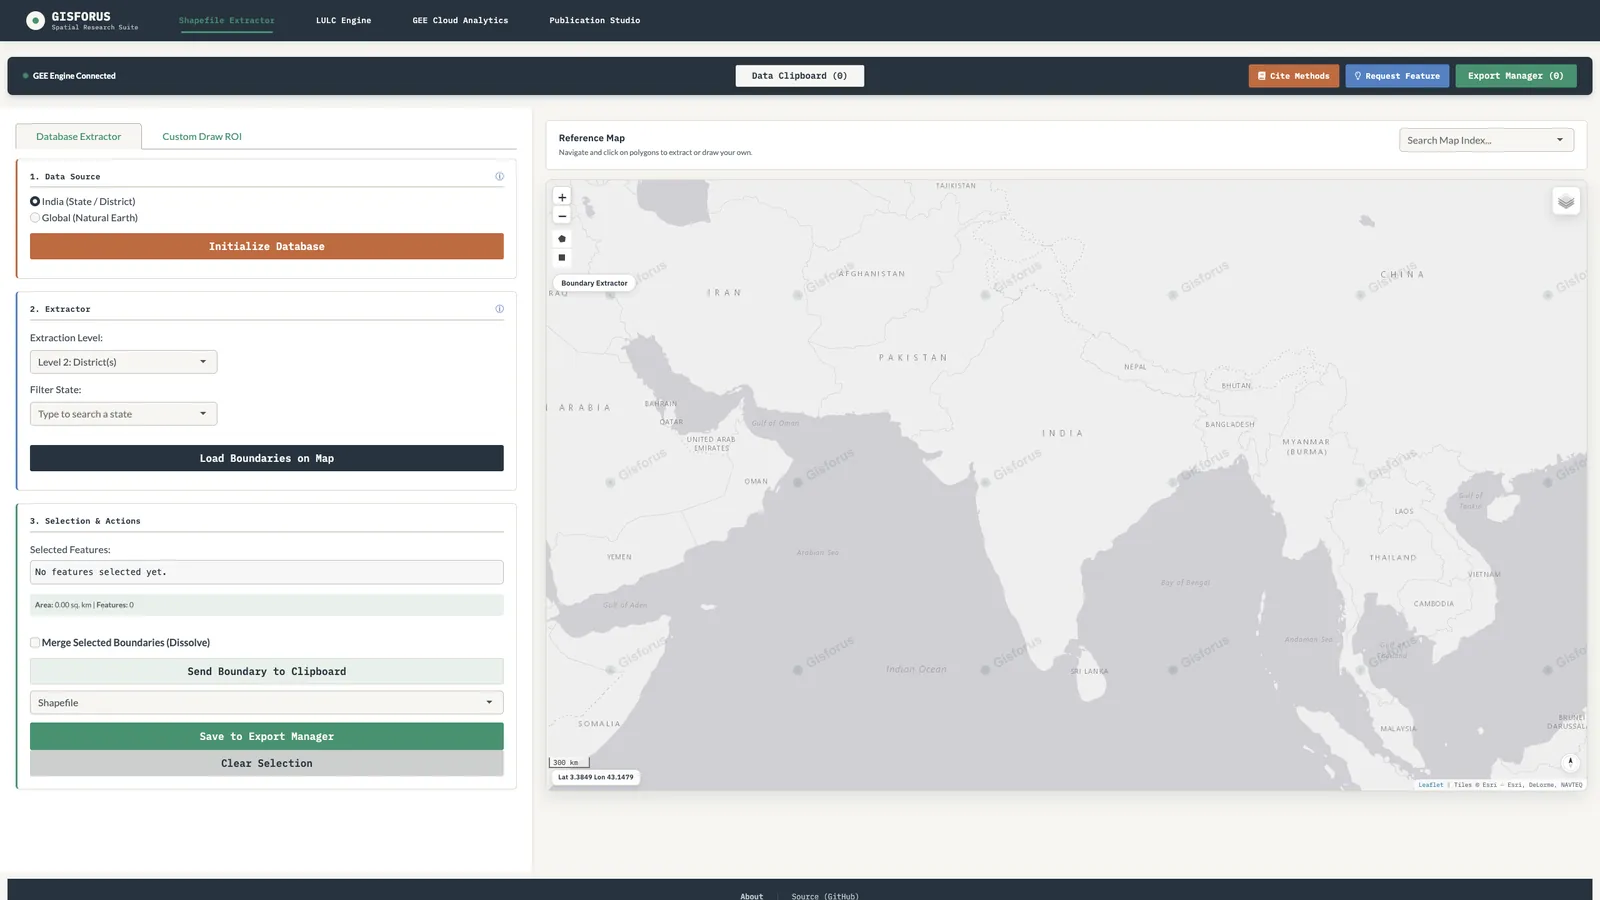
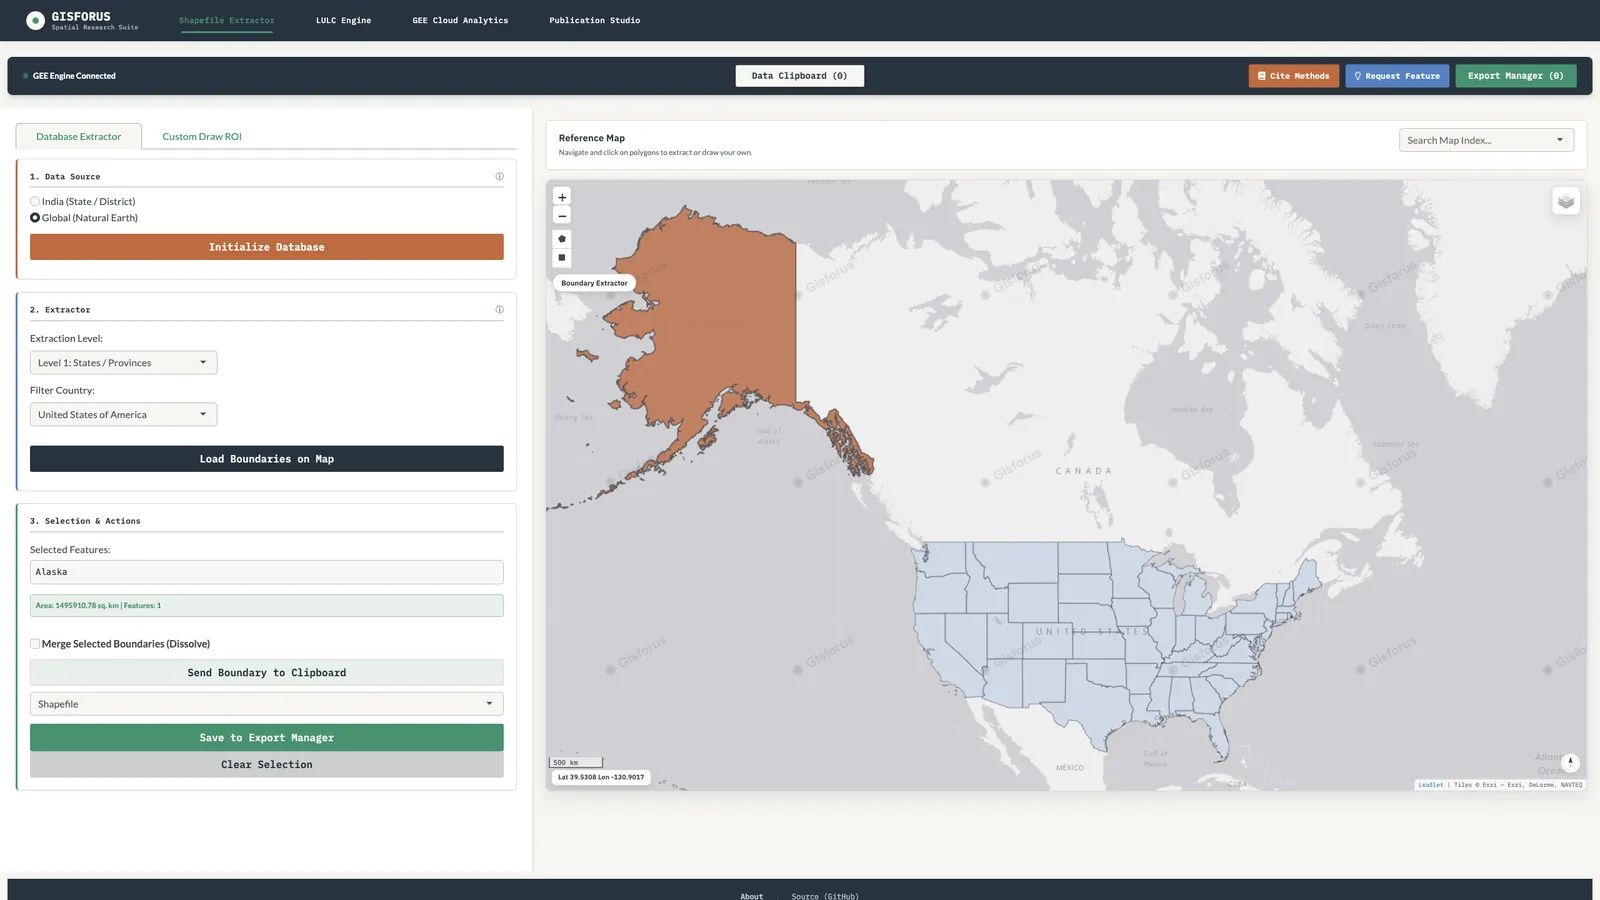
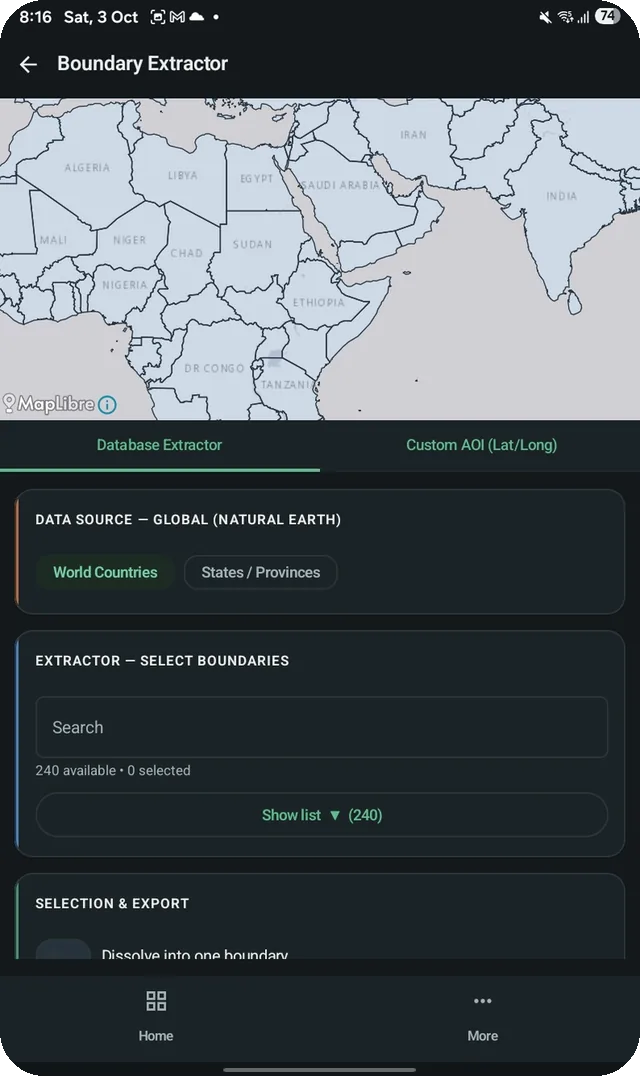
Upload a shapefile, draw a boundary directly on the map, or extract one from built-in administrative datasets (India down to village level, or any country globally).

02

Run an analysis or train a classifier

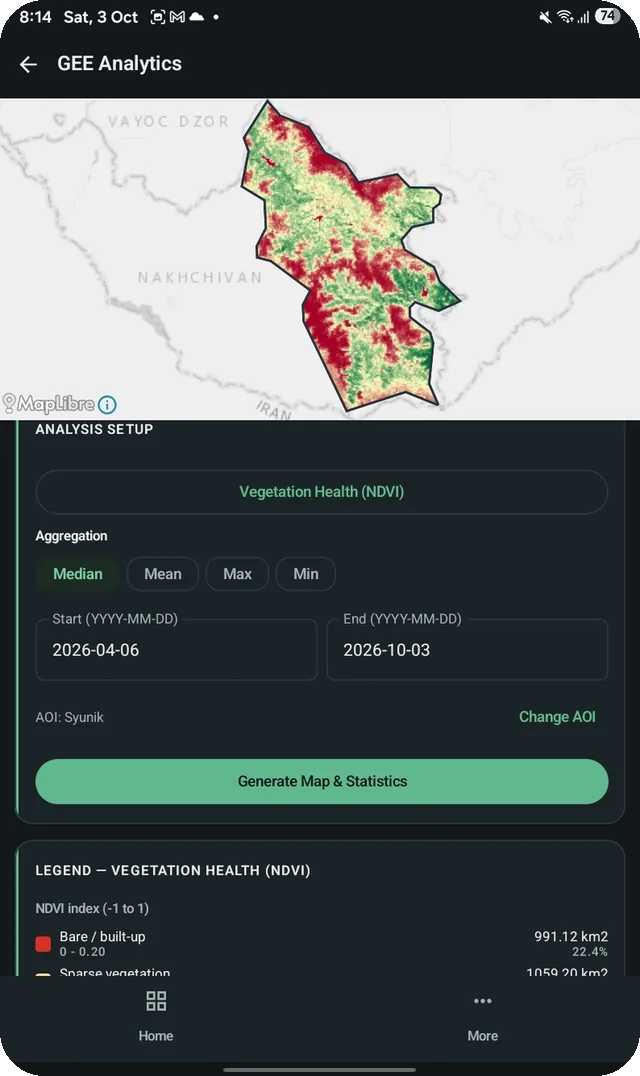
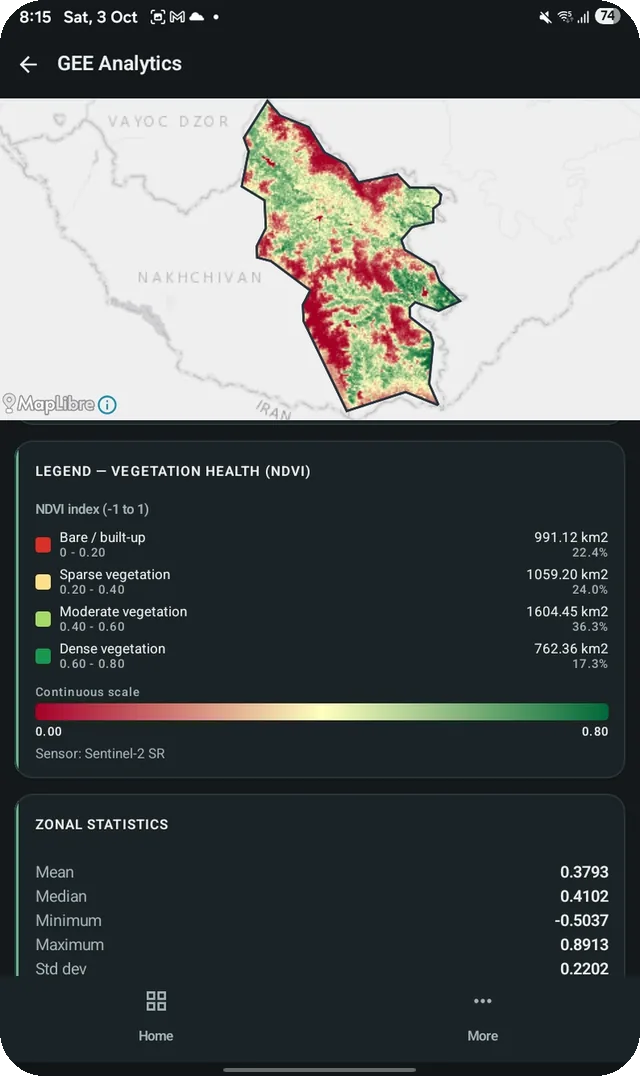
Pick from vegetation health, surface temperature, precipitation, nighttime lights, and a dozen other Earth Engine datasets — or label training points and train a land-cover classifier.

03

Get statistically validated results

Every result comes with the numbers behind it: accuracy and kappa on held-out test data, Mann-Kendall significance, confidence intervals — not just a colored map.

04

Export a publication-ready output

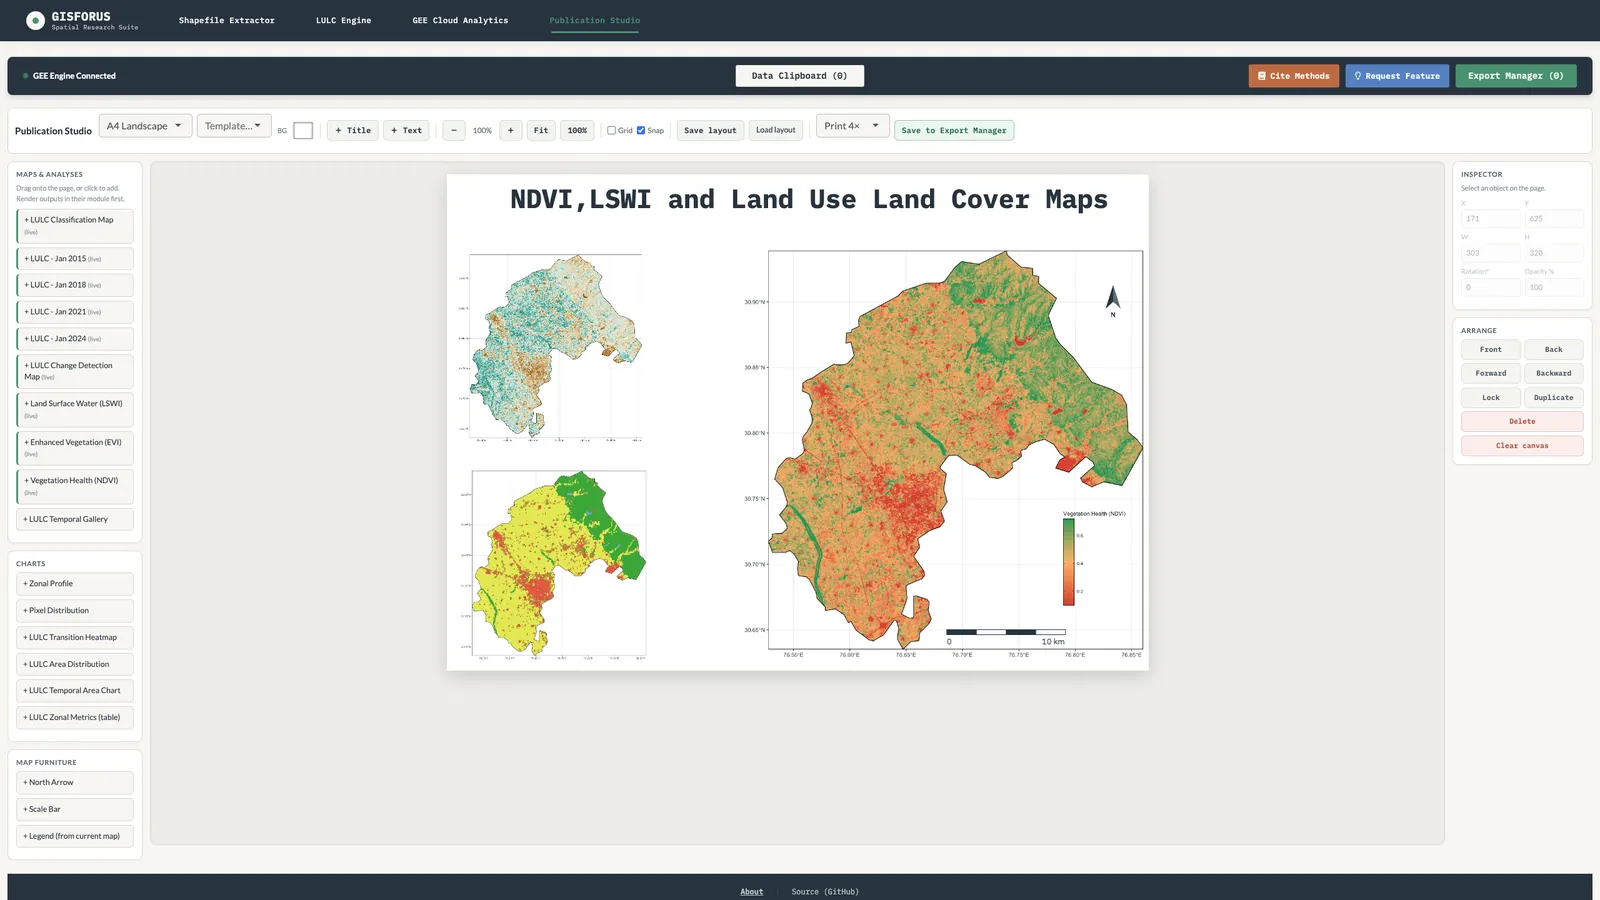
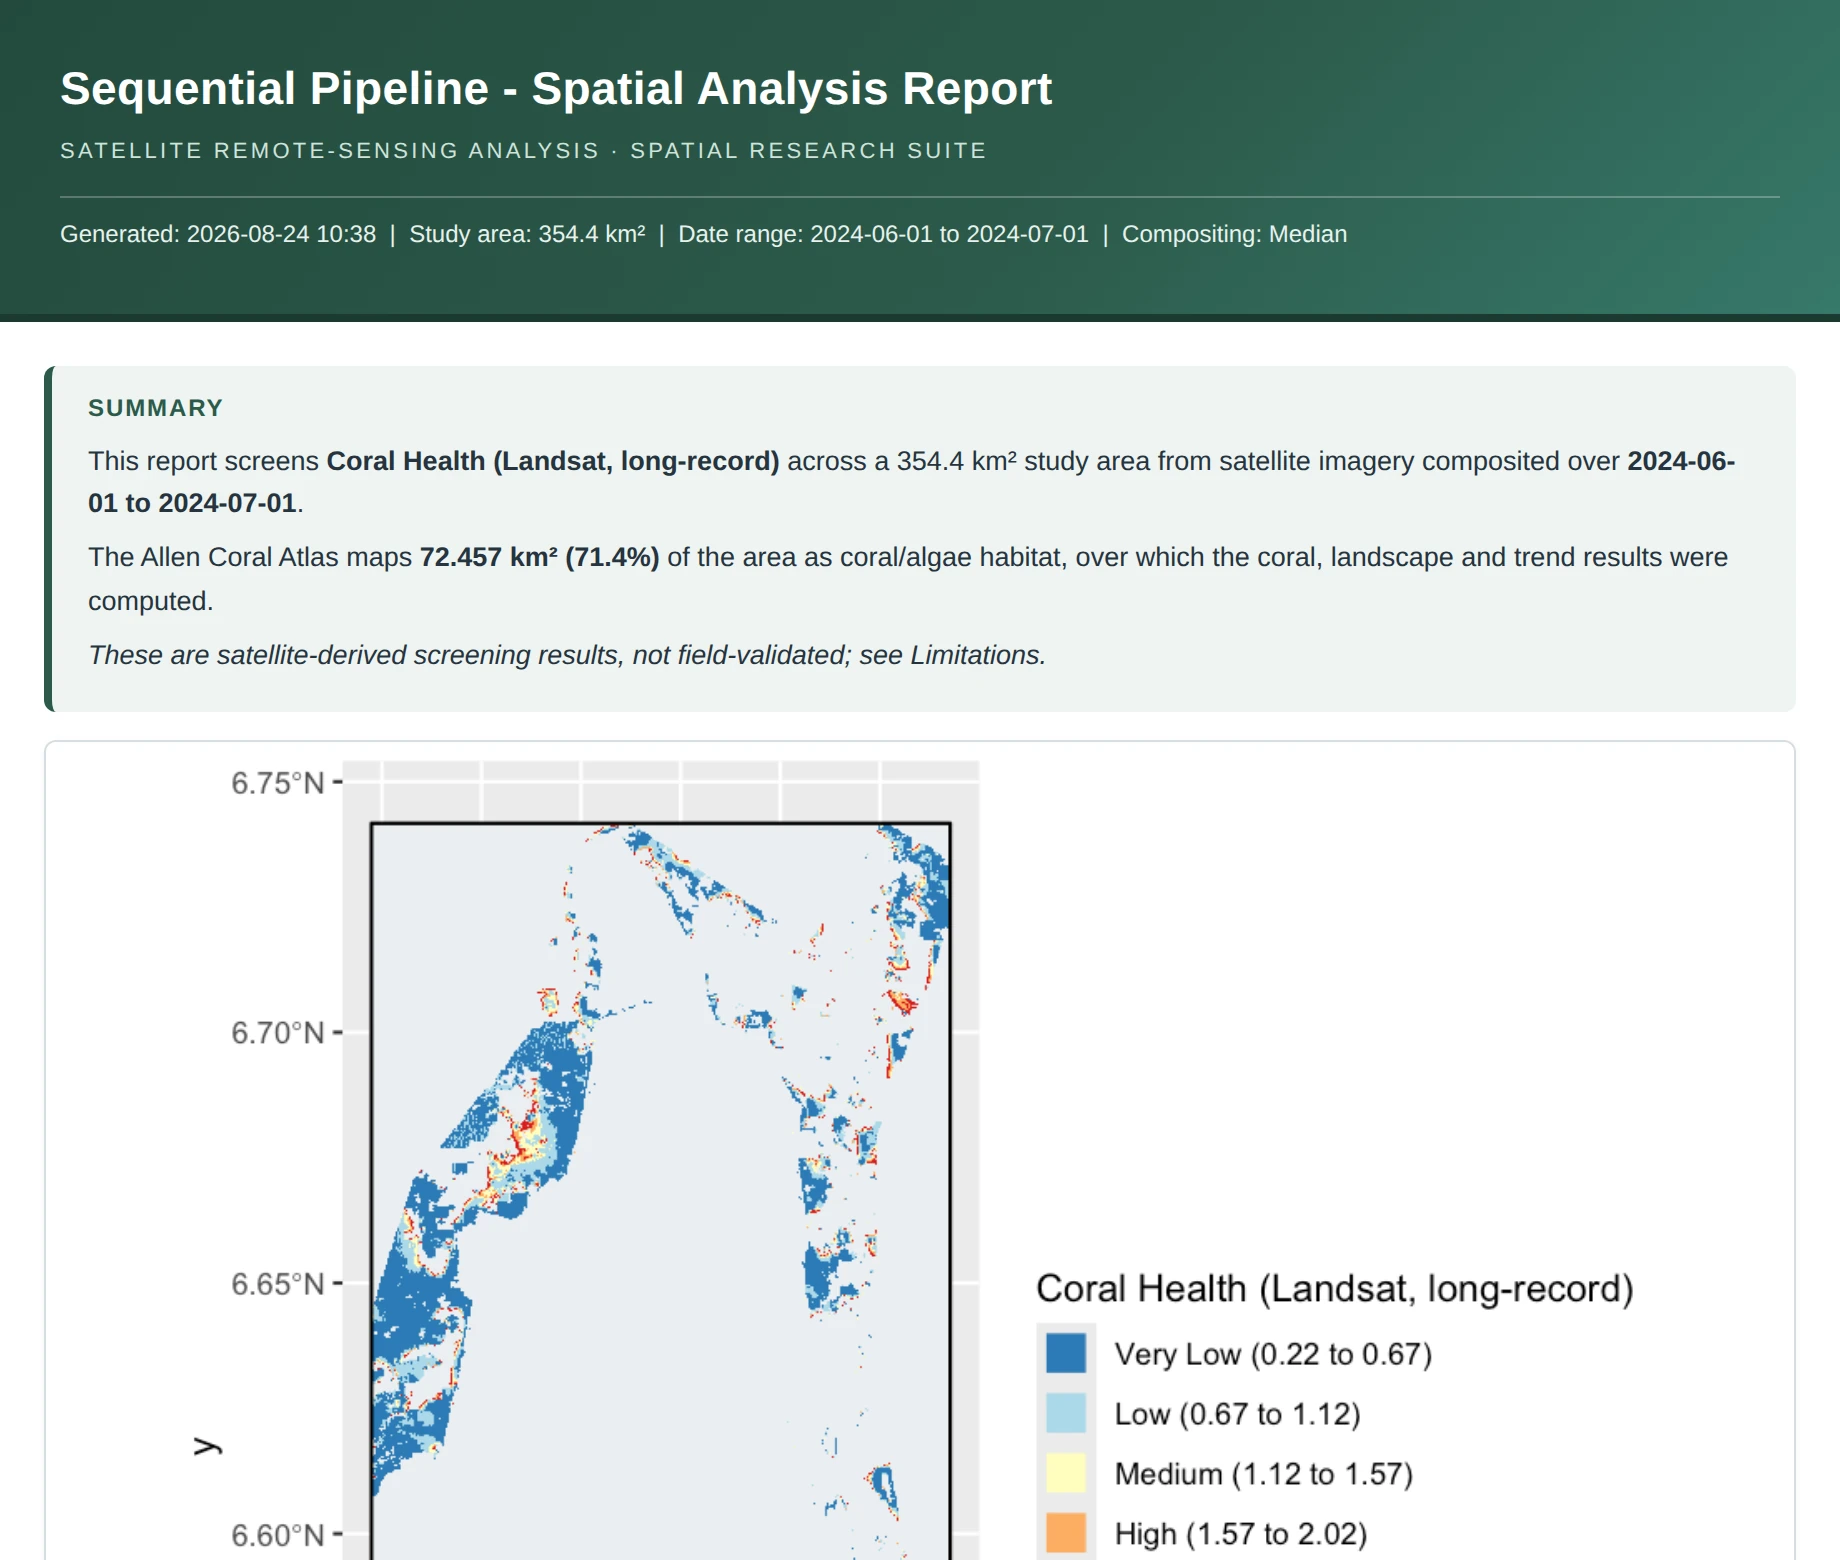
Download a cartographic map with a north arrow, scale bar, and legend, plus an auto-generated methodology report listing exact datasets, parameters, and citations.

People who work with satellite data.

Researchers

Reproducible methodology reports and defensible accuracy metrics, for work that needs to hold up in peer review.

Urban planners

Track land-use change and urban heat over time across a district or state, without commissioning a custom analysis.

Environmental consultants

Batch-process zonal statistics across many boundaries at once, and export client-ready cartography directly.

Graduate students

Run a full classification workflow — training, validation, accuracy assessment — without setting up a Python or GEE development environment.

The details that make results defensible.

Specifics that matter if you're going to cite this in a report or a paper.

Pay for what you use.

No subscription. No account required. Two ways to pay, processed securely through Razorpay.

Per asset

$0.50 / export

Download a single map, chart, or data table. Pay only for the specific result you need.

Session unlock

$1.00 / session

Unlimited downloads for the rest of your current session — worthwhile once you need more than two exports.

Questions worth answering upfront.

Do I need a GIS background to use this?

No. The interface walks you through each step (set a boundary, pick a feature or train a classifier, review results). That said, the outputs — accuracy metrics, significance tests, confidence intervals — are built for people who'll recognize and use them, so a research or planning background helps you get the most out of it.

How accurate are the classification results?

Accuracy and kappa are computed on a held-out test split (30% of your training points, never seen during training) whenever you provide at least 20 points — not on the same data the classifier trained on, which is a common shortcut that inflates the number. Below that threshold, the report tells you explicitly that you're seeing training-data accuracy, not held-out validation.

Is my uploaded data safe?

Boundary and shapefile data you upload or draw lives only in your active browser session — it's used to run the analysis you request and isn't permanently stored or shared with third parties. See the Privacy Policy for details.

What satellite data sources does it use?

Landsat 5, 7, 8, and 9 (harmonized back to 1984), Sentinel-2, CHIRPS precipitation, SRTM elevation, VIIRS nighttime lights, and WorldPop population density — all accessed through Google Earth Engine's public data catalog.

Can I cite results from this in a paper or report?

Yes — every export includes an auto-generated methodology note listing the exact datasets, date ranges, spatial resolution, and classifier parameters used, plus citations for the underlying data sources, so your methodology section is reproducible.

Is there a subscription?

No. Every payment is one-time — either for a single export or for unlimited downloads within your current session. Nothing recurs, and no account is required.

Who built this.

Anant Kumar Pathak

Dr. Anant Kumar Pathak — PhD, former Assistant Professor, working in GIS and spatial analysis.

LinkedIn

Set a boundary and see what the data shows.

Launch the app →